Tom Rutter

Hi! I’m an Economics PhD student at Stanford, where I’m supported by a Knight-Hennessy Scholarship. My google scholar page is here. My email is trutter (at) stanford [dot] edu.
Preprints
2025
- SocArXiv
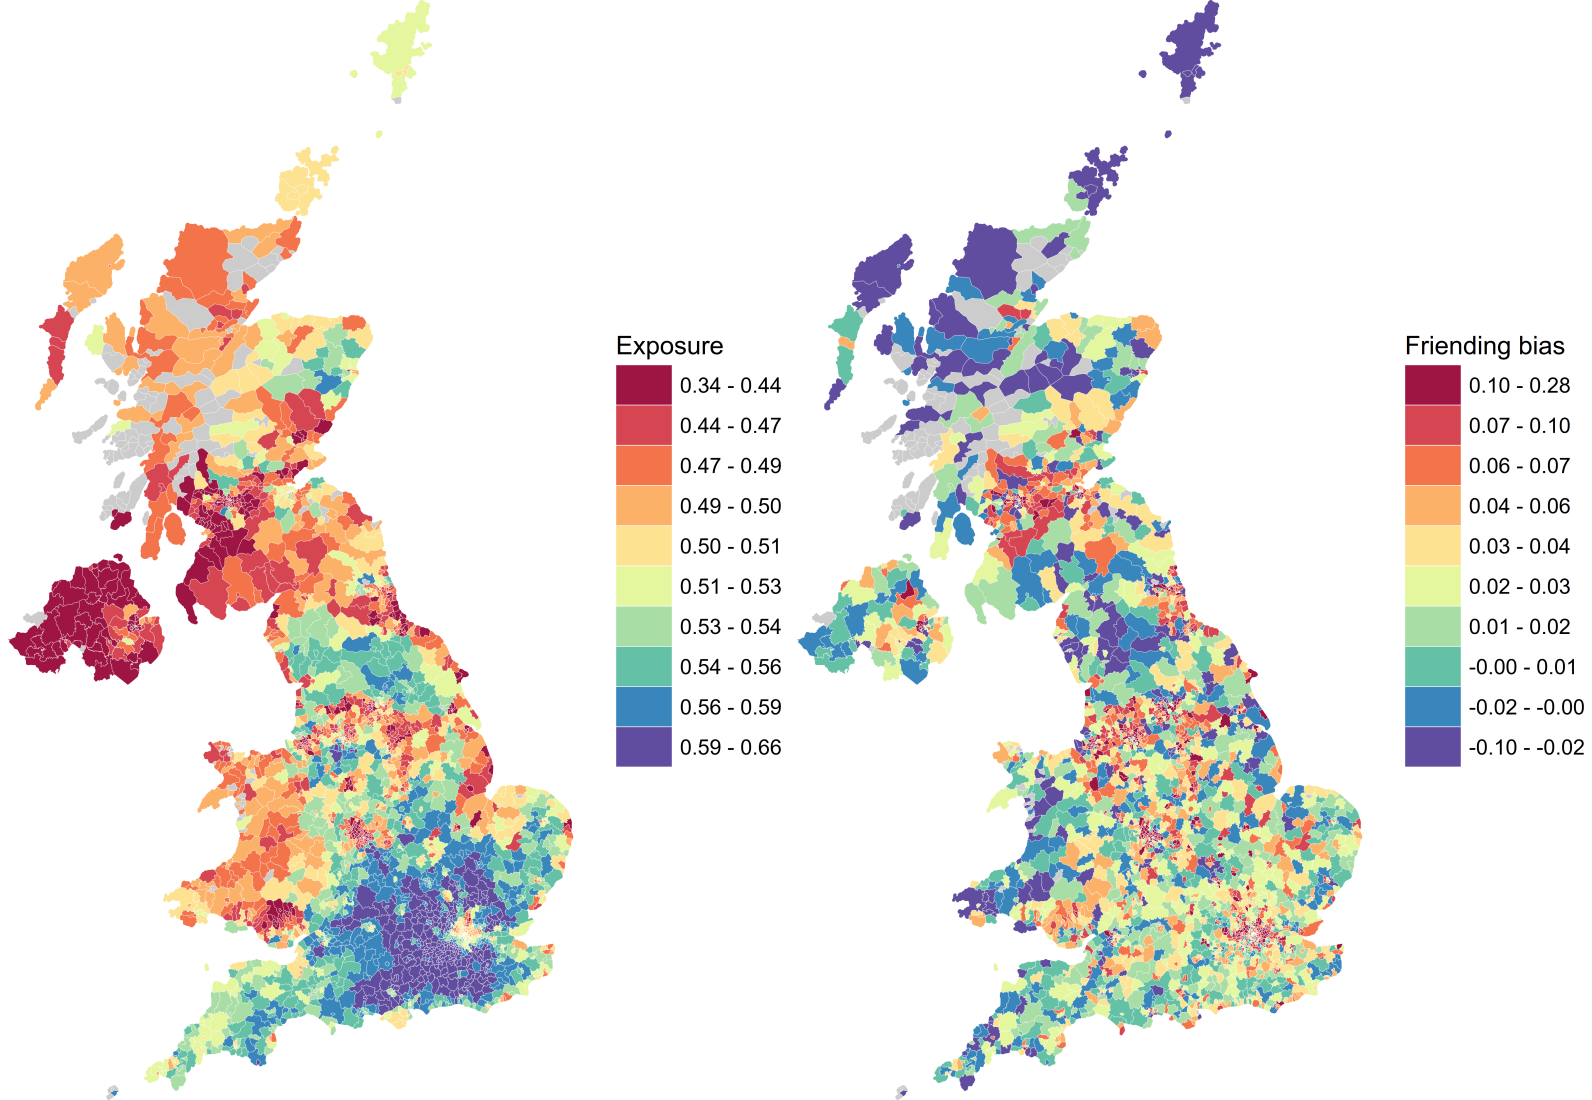 Social Capital in the United Kingdom: Evidence from Six Billion FriendshipsTom Harris, Shankar Iyer, Tom Rutter, Drew Johnston, and 9 more authors2025Media Coverage: The Economist, The Guardian 1, The Guardian 2, The Independent, The Standard, The Times
We construct a range of measures of social capital (the strength and structure of social networks) for the United Kingdom using data from Facebook covering 20.5 million adults. We make these measures publicly available. Low-socioeconomic-status (SES) individuals have far fewer high-SES friends than high-SES individuals do. Areas with more cross-SES friendships display higher levels of intergenerational economic mobility (higher adult earnings for children growing up in disadvantaged families). Most of the difference in connectedness to high-SES individuals between low- and high-SES individuals is due to differences in friending bias—the tendency of people to befriend others similar to themselves even conditional on the possible friends they are exposed to. Areas with more long ties (friendships between people with no mutual connections) also display substantially higher levels of intergenerational economic mobility, and long ties are especially likely to form outside the typical settings in which individuals make friends. The relationships between economic connectedness, long ties, and intergenerational economic mobility remain strong even after controlling for other area-level characteristics. We also make new estimates of intergenerational economic mobility in the UK publicly available, including the first estimates for areas in Scotland and Northern Ireland.
Publications
2024
- QJE
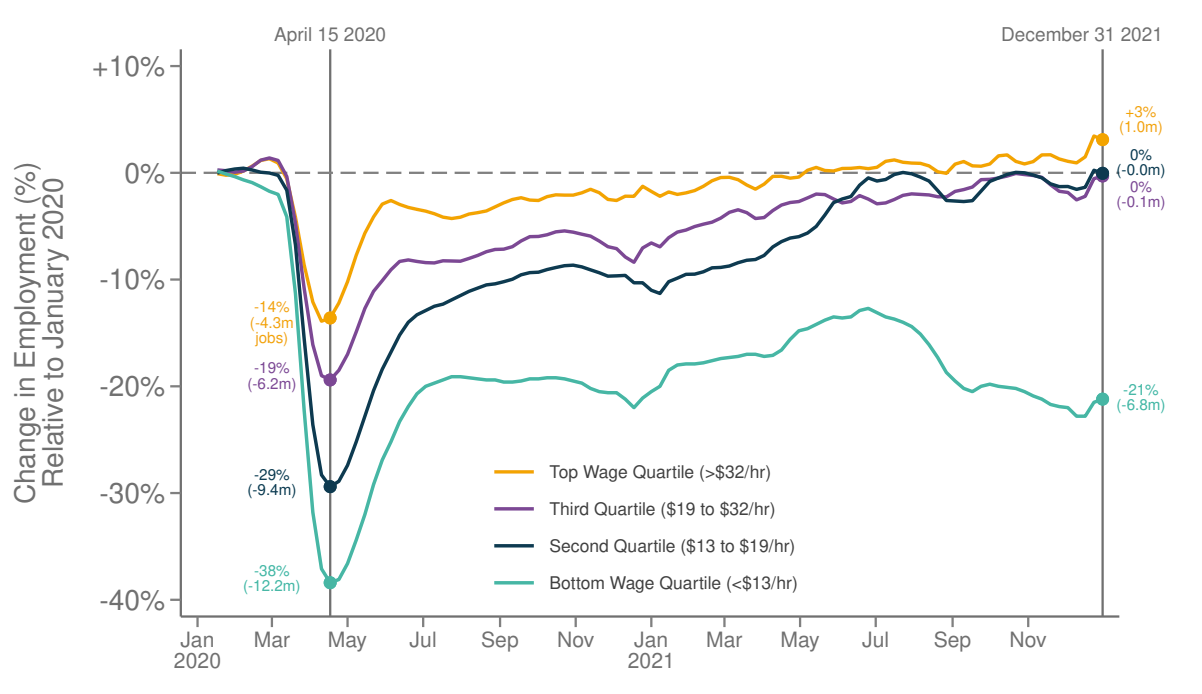 The Economic Impacts of COVID-19: Evidence from a New Public Database Built Using Private Sector DataRaj Chetty, John N Friedman, Michael Stepner, and The Opportunity Insights TeamThe Quarterly Journal of Economics, 2024
We build a publicly available database that tracks economic activity in the United States at a granular level in real time using anonymized data from private companies. We report weekly statistics on consumer spending, business revenues, job postings, and employment rates disaggregated by county, sector, and income group. Using the publicly available data, we show how the COVID-19 pandemic affected the economy by analyzing heterogeneity in its effects across subgroups. High-income individuals reduced spending sharply in March 2020, particularly in sectors that require in-person interaction. This reduction in spending greatly reduced the revenues of small businesses in affluent, dense areas. Those businesses laid off many of their employees, leading to widespread job losses, especially among low-wage workers in such areas. High-wage workers experienced a V-shaped recession that lasted a few weeks, whereas low-wage workers experienced much larger, more persistent job losses. Even though consumer spending and job postings had recovered fully by December 2021, employment rates in low-wage jobs remained depressed in areas that were initially hard hit, indicating that the temporary fall in labor demand led to a persistent reduction in labor supply. Building on this diagnostic analysis, we evaluate the effects of fiscal stimulus policies designed to stem the downward spiral in economic activity. Cash stimulus payments led to sharp increases in spending early in the pandemic, but much smaller responses later in the pandemic, especially for high-income households. Real-time estimates of marginal propensities to consume provided better forecasts of the impacts of subsequent rounds of stimulus payments than historical estimates. Overall, our findings suggest that fiscal policies can stem secondary declines in consumer spending and job losses, but cannot restore full employment when the initial shock to consumer spending arises from health concerns. More broadly, our analysis demonstrates how public statistics constructed from private sector data can support many research and real-time policy analyses, providing a new tool for empirical macroeconomics.
2022
- Nature
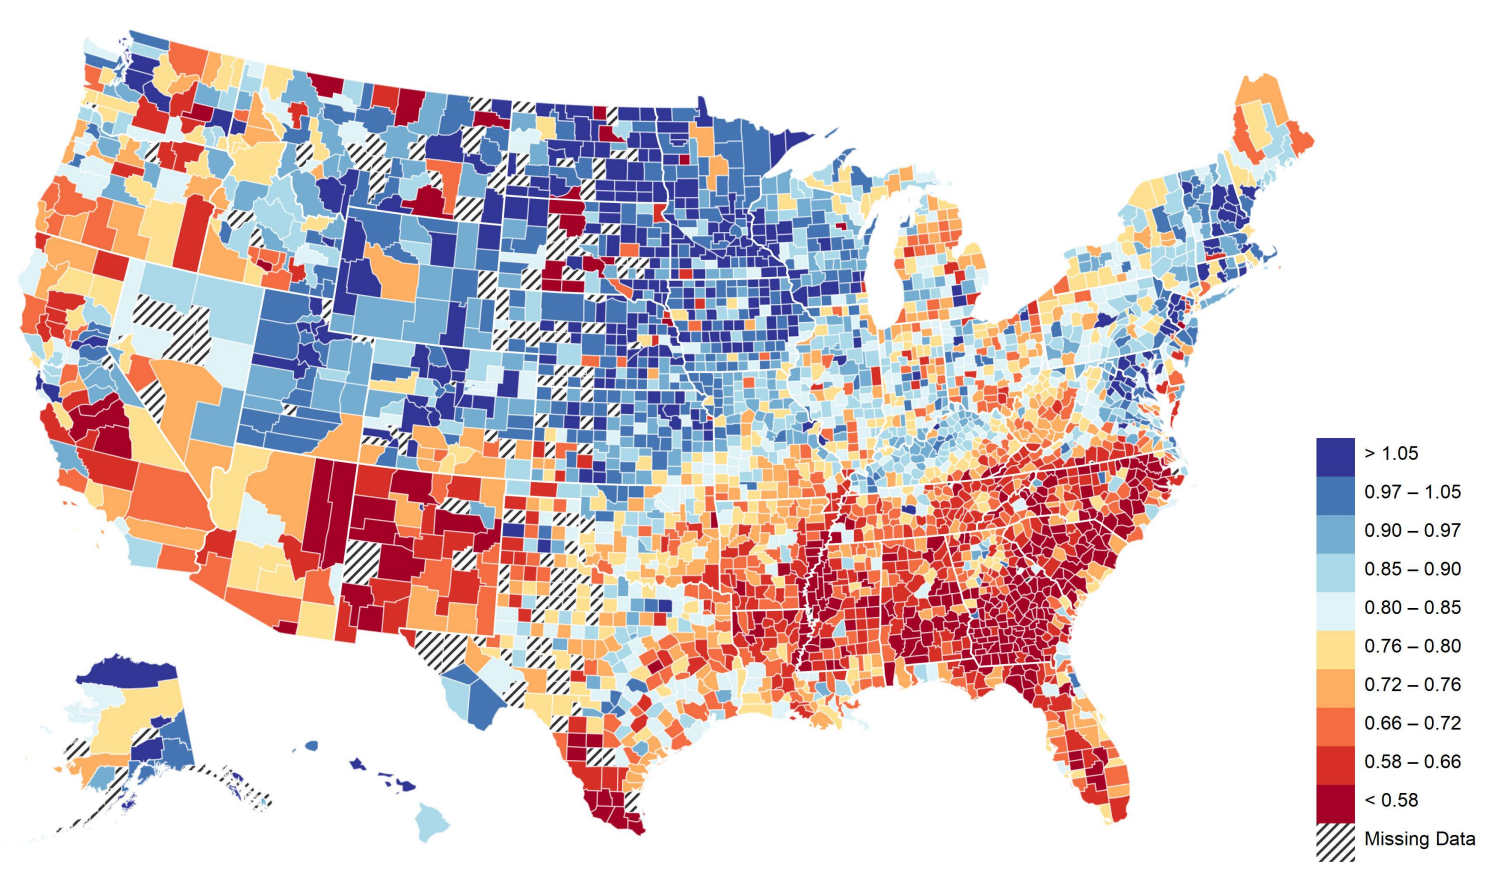 Social Capital I: Measurement and Associations with Economic MobilityRaj Chetty, Matthew O. Jackson, Theresa Kuchler, Johannes Stroebel, and 18 more authorsNature, 2022Media Coverage: Axios, Brookings, CBS, Economist 1, Economist 2, Nature, Nature Podcast, New Scientist, New York Times 1, New York Times 2, New York Times 3, NPR, The Verge, Washington Post
Social capital—the strength of an individual’s social network and community—has been identified as a potential determinant of outcomes ranging from education to health. However, efforts to understand what types of social capital matter for these outcomes have been hindered by a lack of social network data. Here, in the first of a pair of papers9, we use data on 21 billion friendships from Facebook to study social capital. We measure and analyse three types of social capital by ZIP (postal) code in the United States: (1) connectedness between different types of people, such as those with low versus high socioeconomic status (SES); (2) social cohesion, such as the extent of cliques in friendship networks; and (3) civic engagement, such as rates of volunteering. These measures vary substantially across areas, but are not highly correlated with each other. We demonstrate the importance of distinguishing these forms of social capital by analysing their associations with economic mobility across areas. The share of high-SES friends among individuals with low SES—which we term economic connectedness—is among the strongest predictors of upward income mobility identified to date. Other social capital measures are not strongly associated with economic mobility. If children with low-SES parents were to grow up in counties with economic connectedness comparable to that of the average child with high-SES parents, their incomes in adulthood would increase by 20% on average. Differences in economic connectedness can explain well-known relationships between upward income mobility and racial segregation, poverty rates, and inequality. To support further research and policy interventions, we publicly release privacy-protected statistics on social capital by ZIP code at https://www.socialcapital.org.
- Nature
 Social Capital II: Determinants of Economic ConnectednessRaj Chetty, Matthew O. Jackson, Theresa Kuchler, Johannes Stroebel, and 18 more authorsNature, 2022
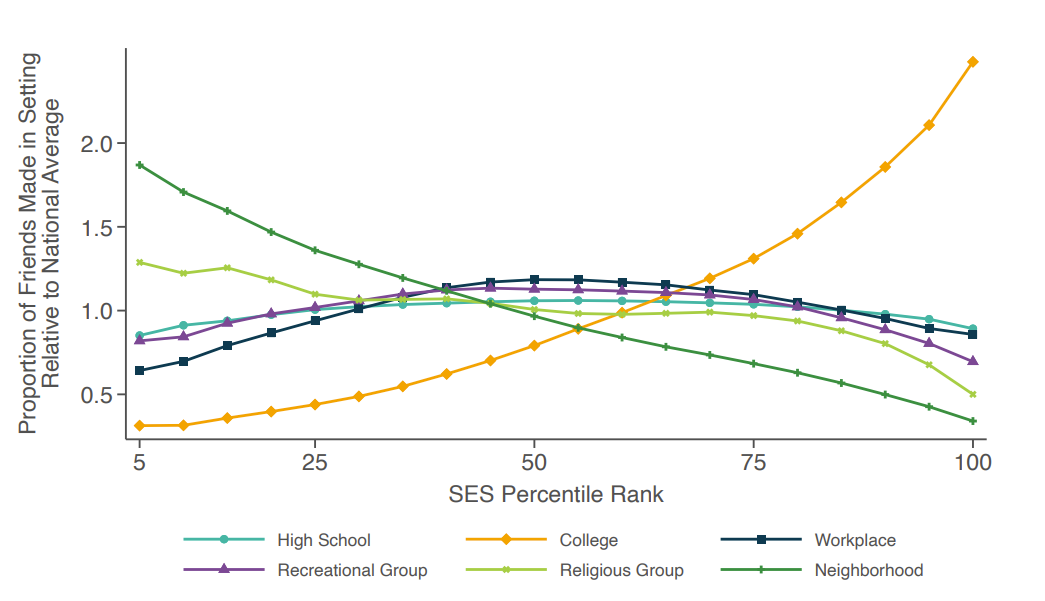
Low levels of social interaction across class lines have generated widespread concern and are associated with worse outcomes, such as lower rates of upward income mobility. Here we analyse the determinants of cross-class interaction using data from Facebook, building on the analysis in our companion paper. We show that about half of the social disconnection across socioeconomic lines—measured as the difference in the share of high-socioeconomic status (SES) friends between people with low and high SES—is explained by differences in exposure to people with high SES in groups such as schools and religious organizations. The other half is explained by friending bias—the tendency for people with low SES to befriend people with high SES at lower rates even conditional on exposure. Friending bias is shaped by the structure of the groups in which people interact. For example, friending bias is higher in larger and more diverse groups and lower in religious organizations than in schools and workplaces. Distinguishing exposure from friending bias is helpful for identifying interventions to increase cross-SES friendships (economic connectedness). Using fluctuations in the share of students with high SES across high school cohorts, we show that increases in high-SES exposure lead low-SES people to form more friendships with high-SES people in schools that exhibit low levels of friending bias. Thus, socioeconomic integration can increase economic connectedness in communities in which friending bias is low. By contrast, when friending bias is high, increasing cross-SES interactions among existing members may be necessary to increase economic connectedness. To support such efforts, we release privacy-protected statistics on economic connectedness, exposure and friending bias for each ZIP (postal) code, high school and college in the United States at https://www.socialcapital.org.
2021
- Economic Journal
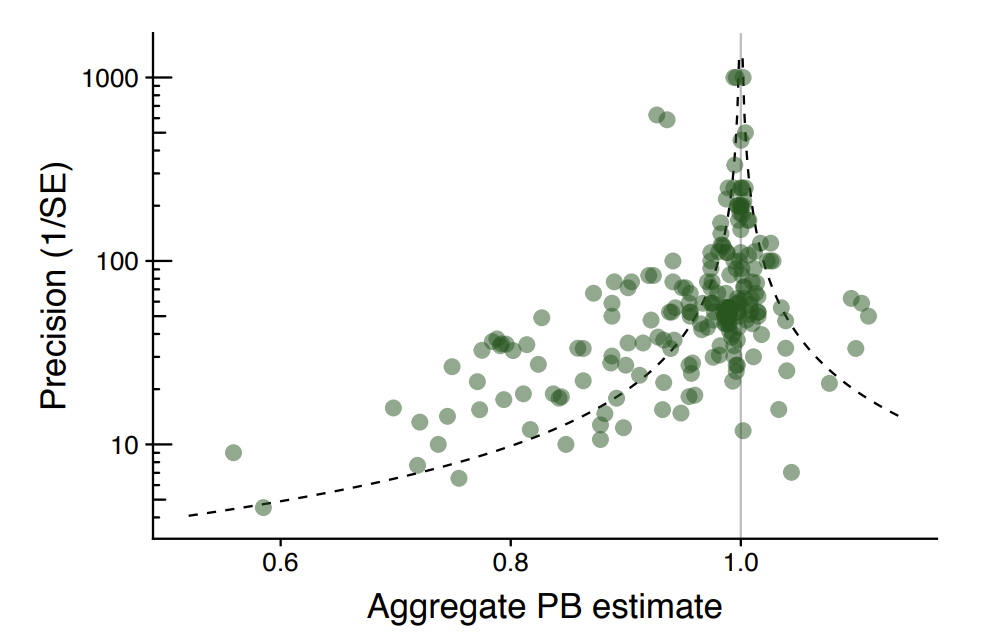 Meta-analysis of present-bias estimation using convex time budgetsTaisuke Imai, Tom A Rutter, and Colin F CamererThe Economic Journal, 2021
We examine 220 estimates of the present-bias parameter from 28 articles using the Convex Time Budget protocol. The literature shows that people are on average present-biased, but estimates exhibit substantial heterogeneity across studies. There is evidence of modest selective reporting in the direction of over-reporting present bias. The primary source of heterogeneity is the type of reward, either monetary or non-monetary, but this effect is weakened after correcting for selective reporting. In studies using monetary rewards, the delay until the issue of the reward associated with the current time period influences estimates of the present-bias parameter.
- JEPS
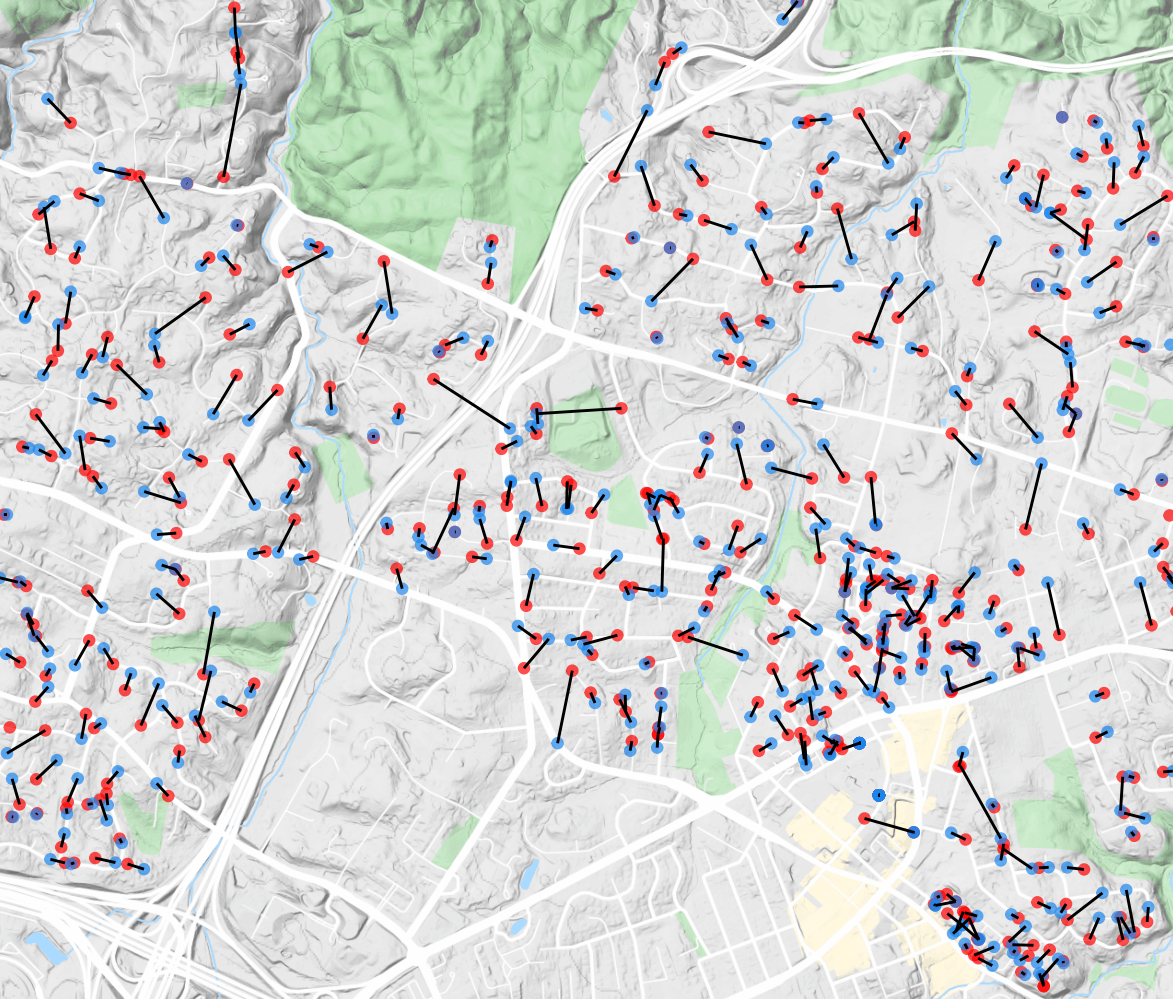 The Effectiveness of a Neighbor-to-Neighbor Get-Out-the-Vote Program: Evidence from the 2017 Virginia State ElectionsCassandra Handan-Nader, Daniel E Ho, Alison Morantz, and Tom A RutterJournal of Experimental Political Science, 2021
We analyze the results of a neighbor-to-neighbor, grassroots get-out-the-vote (GOTV) drive in Virginia, in which unpaid volunteers were encouraged to contact at least three nearby registered voters who were likely co-partisans yet relatively unlikely to vote in the 2017 state election. To measure the campaign’s effectiveness, we used a pairwise randomization design whereby each volunteer was assigned to one randomly selected member of the most geographically proximate pair of voters. Because some volunteers unexpectedly signed up to participate outside their home districts, we analyze the volunteers who adhered to the original hyper-local program design separately from those who did not. We find that the volunteers in the original program design drove a statistically significant 2.3% increase in turnout, which was concentrated in the first voter pair assigned to each volunteer. We discuss implications for the study and design of future GOTV efforts.